
Console debugging
An important aspect of implementing tracking code is being able to debug what you want to do. At Harvest we try to provide as many debugging features as possible.
Debugging is done in the console. We will use the Chrome Developer Tools as an example. During our examples we use the implementation on https://graindataconsultants.com/.
Turn debugging on
To turn debugging on, you can use the setDebug function.
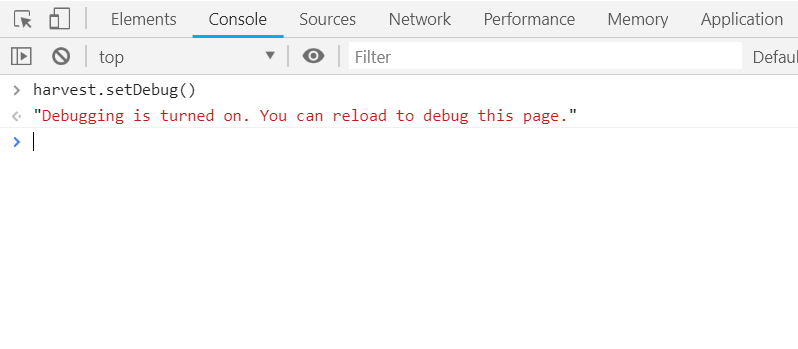
As mentioned in the console, you need to refresh the page to see the effect of the debuggin features.
After you have reloaded, you will see something similar to this:
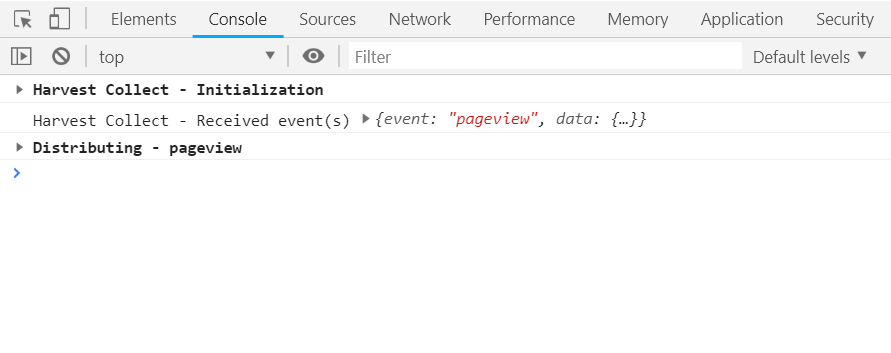
The first thing you will notice is the line Harvest Collect - Initalization. This line should always be available, also when you have not yet triggered any event. This tells you that Harvest Collect is succesfully loaded and initialized. From this point the data attributes will also be handled.
On line 2 you see the pageview event that has been received by Harvest.
On line 3 you see the final result of the event received in line 2.
We have the following main debug logs:
- Harvest Collect - Initialization
- Distributing - pageview
- Distributing - contentview - <viewType>
- Distributing - click - <clickType>
- Distributing - change
- Distriubting - funnelstepview - <funnelName> - <funnelStep>
- Distributing - dataview
In Chrome you will see that it is possible to expand the Distributing - pageview line.
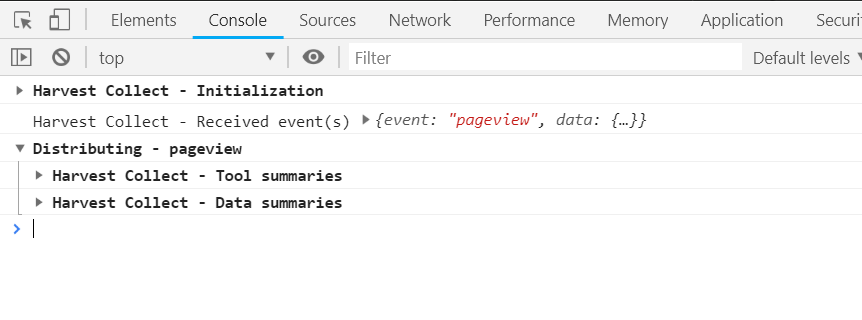
As you can see, this will result in 2 summaries.
Harvest Collect - Tool summaries
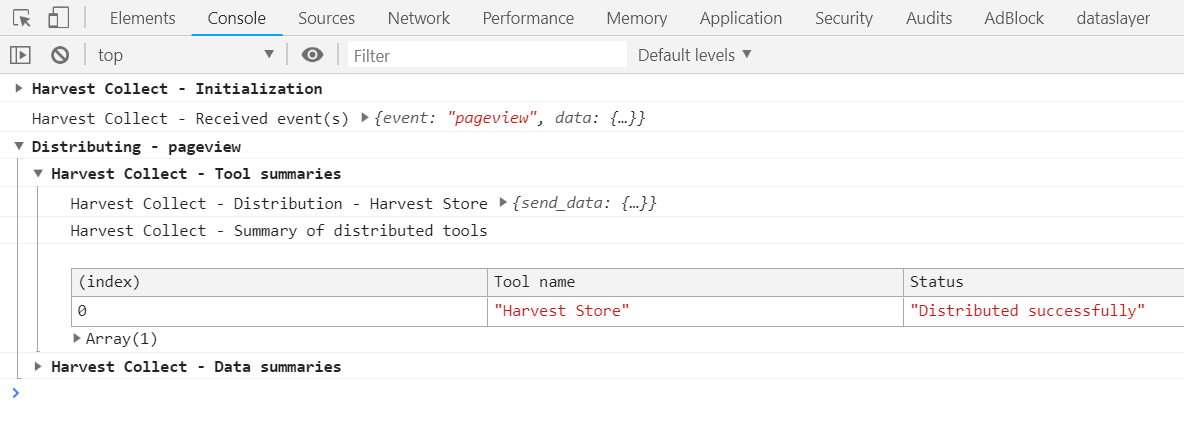
This overview shows you all information about the tools to which data has been sent. In this example there was one tool configured: Harvest Store.
This summary always has two parts:
- A list of all tools to which data has been sent and the data object that has been sent.
- An overview of all tools that have been configured for distribution and information about the status.
The status tells something about how whether data has been distributed or not and if not, why it has not been sent.
For more information about how Harvest Collect distributes data to tools, read our distribution and execution documentation.
Harvest Collect - Data summaries
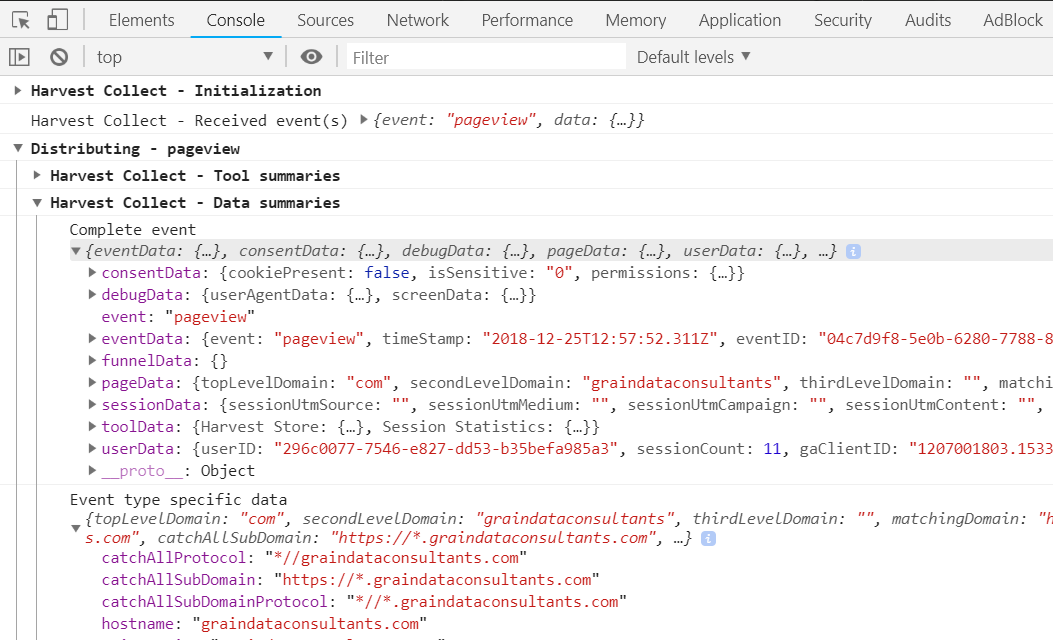
This overview shows you what the final data object looks like. It helps you debug whether you have configured all of your variables correctly. It easily shows you what tool configurations are mode (or not) and you can check which variables are available for distribution.
Fore more information about the final event, read our final event documentation.
There are two objects to be viewed:
- The complete event with all data in it.
- Event type specific data, this speeds up the debugging process. Below, you will find the mapping of event type and the data object.
| Event type | Variable group in specific data |
|---|---|
| pageview | pageData |
| contentview - products related | productData |
| contentview - contents related | contentData |
| contentview - promotions related | promotionData |
| click - products related | productData |
| click - contents related | contentData |
| click - promotions related | promotionData |
| change | eventData |
| dataview | eventData |
| funnelstepview | funnelData |

